The Blog
I've written 18 blog posts in 2019, which is below the target I set at the start of the year (two blog posts a month, for a total of 24), but it's progress.
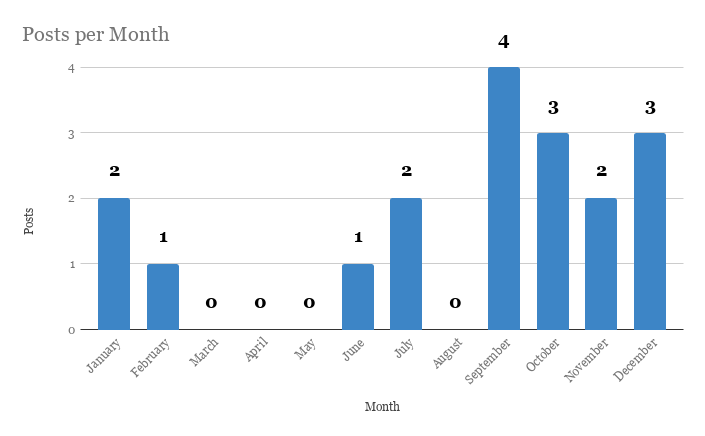
In comparison, I wrote only 1 post in 2018. 🙈
Transport
I've taken 265 bus rides in 2019, down from 556 in 2018. There is a dramatic reduction in bus rides after the Easter Attacks in April.
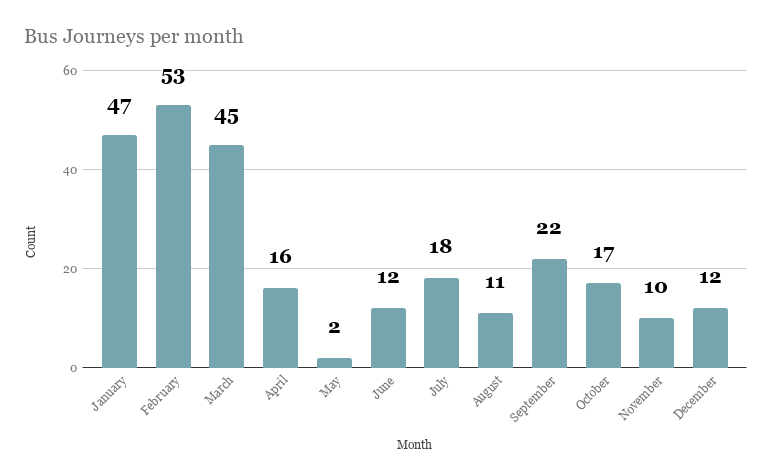
After April, I switched to tuks as my primary mode of commuting to work in the morning, only taking the bus in the evening during my commute home.
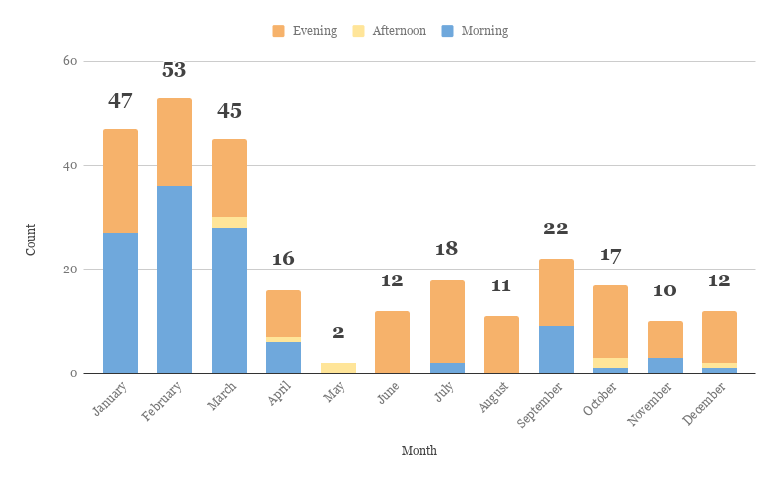
| Month | Morning | Afternoon | Evening |
|---|---|---|---|
| January | 27 | 0 | 20 |
| February | 36 | 0 | 17 |
| March | 28 | 2 | 15 |
| April | 6 | 1 | 9 |
| May | 0 | 2 | 0 |
| June | 0 | 0 | 12 |
| July | 2 | 0 | 16 |
| August | 0 | 0 | 11 |
| September | 9 | 0 | 13 |
| October | 1 | 2 | 14 |
| November | 3 | 0 | 7 |
| December | 1 | 1 | 10 |
| Total | 113 | 8 | 144 |
Tuks have picked up the slack, with 245 PickMe rides1, 29 rides on YOGO and normal metered tuks, and 5 rides on shared Ubers2 throughout the year.
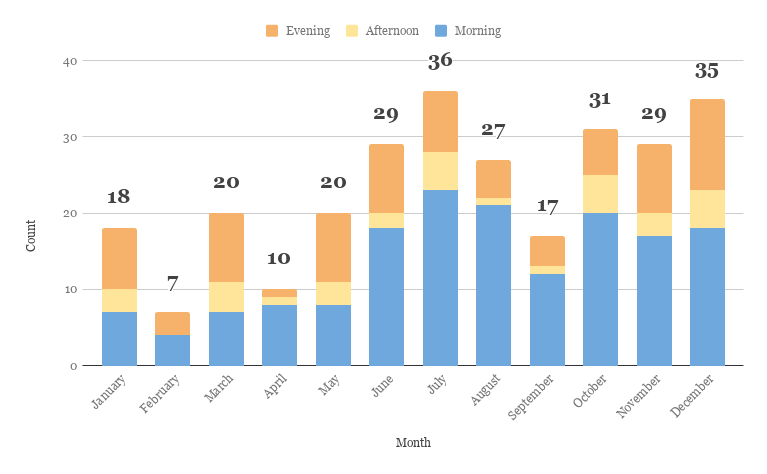
| Month | Morning | Afternoon | Evening |
|---|---|---|---|
| January | 7 | 3 | 8 |
| February | 4 | 0 | 3 |
| March | 7 | 4 | 9 |
| April | 8 | 1 | 1 |
| May | 8 | 3 | 9 |
| June | 18 | 2 | 9 |
| July | 23 | 5 | 8 |
| August | 21 | 1 | 5 |
| September | 12 | 1 | 4 |
| October | 20 | 5 | 6 |
| November | 17 | 3 | 9 |
| December | 18 | 5 | 12 |
| Total | 163 | 33 | 83 |
While initially driven by post-Easter attack paranoia, environmental factors have also been a concern especially with the increase in average temperatures. Although still a firm believer in public transport, I no longer wanted to turn up at work a sweaty mess. Let's hope A/C buses start rolling out on the 138 route soon3. 🙏🏽
These are the ride counts and average fares for 2019 in comparison to 2018:
| Type | Count (2018) | Avg (2018) | Count (2019) | Avg (2019) | Count Diff | Avg Diff |
|---|---|---|---|---|---|---|
| Bus | 556 | 19.84 | 265 | 21.91 | -291 | +2.07 |
| PickMe | 153 | 424.08 | 245 | 394.35 | +92 | -29.73 |
| Tuk | 12 | 142.08 | 29 | 356.21 | +17 | +214.12 |
| Uber | 3 | 233.33 | 5 | 500.00 | +2 | +266.67 |
| Total | 724 | 544 | -180 |
Huh, never realised I'd taken 180 less journeys in total this year. Must be all the sleeping in on weekends. 🙈
Other Expenses
I've bought food 247 times in 2019, up from 200 times in 2018. The average order value has gone up slightly, from 572 LKR to 600 LKR. I've bought clothing 4 times, up from just 2 times in 2018.
I've made 16 purchases on AliExpress this year, up from 5 purchases last year. The average order value has stayed roughly the same.
Social Media
I've been on a bit of a hiatus from Twitter and Instagram, with only 6 images posted on my IG this year (and none since June). But I did start an Instagram purely for my illustrations and I've managed to post about 29 posts in the space of a month.
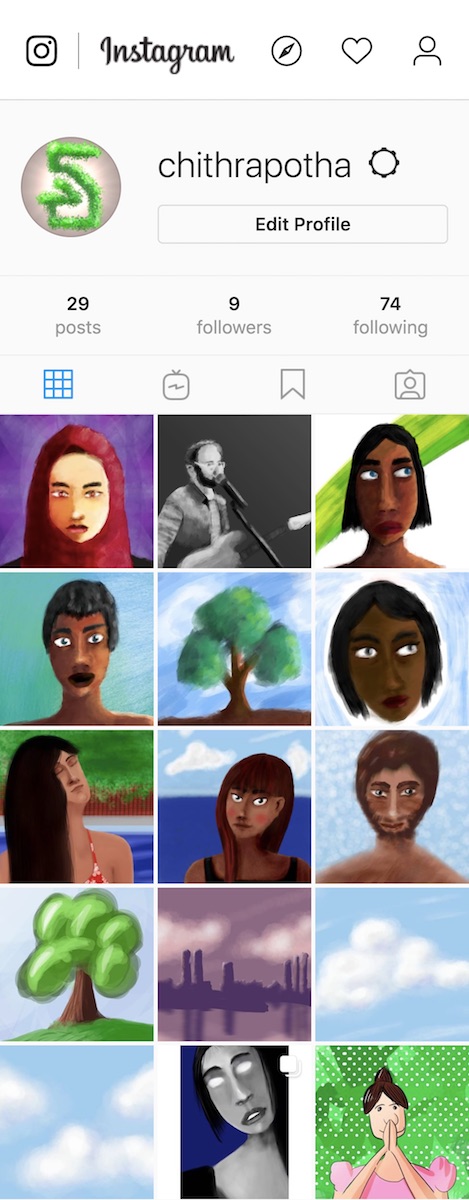
Drawing more and putting it out there is a goal that I want to work towards in 2020. I've also uploaded 18 song snippets to my SoundCloud, and plan to upload longer and more developed pieces in 2020 (fingers crossed!)
* * *
And so, those are some of my stats for the year. How has 2019 been for you and how do you plan to spend your 2020?
-
Up from 153 in 2018. ↩
-
I still don't have an Uber account, and don't plan on getting one. ↩
-
And eventually we can all take the Kelani Valley railway, which is currently incredibly under-utilised. ↩